CATL Quantitative Analysis: The Fundamentals Behind the AI Revenue Forecast Model
2021-05-11 14:57:59
Introduction: We have built a stable and effective integrated human-machine revenue forecast model updated on a real-time basis according to our systematic review of the fundamental drivers of companies and cutting-edge AI algorithms. In accordance with the basic principles of detailed breakdowns and rigorous analysis, and underpinned by logical fundamental relationships, we have included various macro, meso and micro factors in our CATL revenue forecast model such as domestic and overseas new energy vehicle (NEV) output, domestic prismatic traction battery penetration rates, and year-on-year change (YoY) in cobalt sulfate output. Based on the inherent patterns of the industry, we have also explored and reviewed a set of factors with strong forecast lead time significance for revenue forecasting, and we have unveiled the hidden quantitative relationships between revenue and these factors.
In this article, we will use CATL as an actual research case study to demonstrate the underlying logic of our revenue forecast model, the structure of the factor system in the investment research framework, and the quantitative relationships between revenue and the key factors. Together with our research framework, we will conduct a quantitative assessment and analysis of CATL’s historical revenue volatility factors, and forecast the company’s 2021 results.
I. Basis for the underlying fundamentals of CATL’s AI earnings forecast model
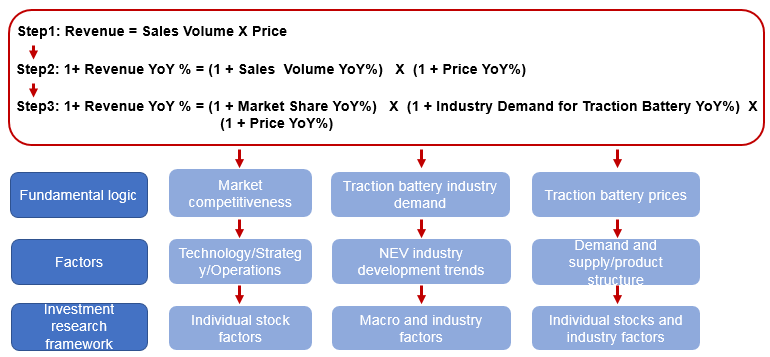
Based on the thinking and deduction of first principles, we have broken down CATL’s revenue growth into traction battery shipment YoY and traction battery shipment prices YoY. Traction battery shipment YoY is further broken down into traction battery market share YoY and industry demand for traction battery YoY. As a result, the three determinants that affect CATL’s revenue are: Market share, overall industry demand and industry prices (hereinafter referred to as the “three key determinants.”) This is the basis for the underlying fundamentals of CATL’s AI revenue forecast model.
Chart 1: The three key determinants of CATL’s revenue growth: Market share, overall industry demand and industry prices
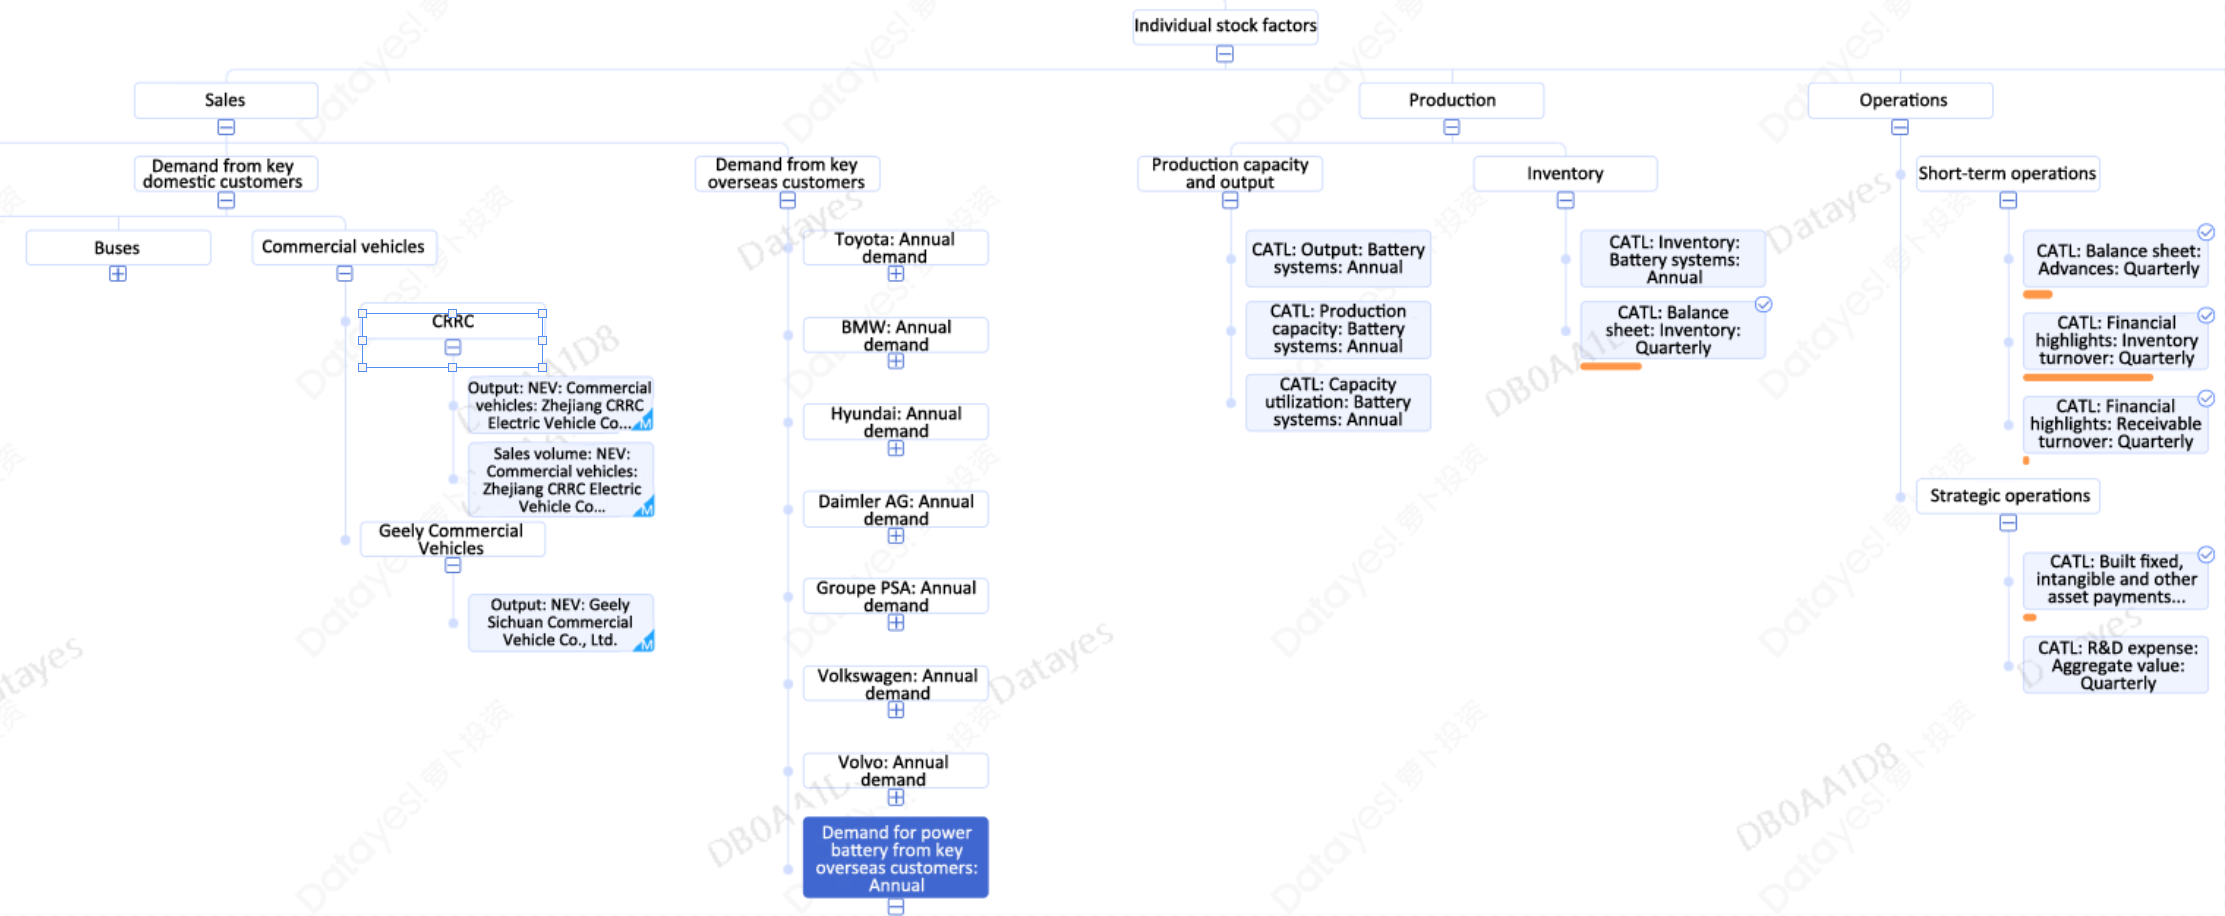
Based on the analytical logic of traditional fundamentals, the technology, strategy and operations of the company and of its competitors are the key factors that affect CATL’s domestic and global traction battery market share. Therefore, we have included factors that are a part of individual stock factor nodes, and on the basis of CATL itself, we have established three sub-nodes, namely, from the perspectives of production, sales and operations. At the same time, we have matched the three sub-nodes under key indicators including output, traction battery installed capacity, fixed asset capital expenditure and inventories of key vehicle customers of the company (indicated in Chart 2). Based on the state of peer competition, we have set up a peer node parallel to the three sub-nodes including production, and we have matched indicators such as shipment and production capacity of other overseas and domestic key traction battery companies under the peer comparison node.
Chart 2. Screenshot of the factor system module of individual stocks in CATL’s investment research framework
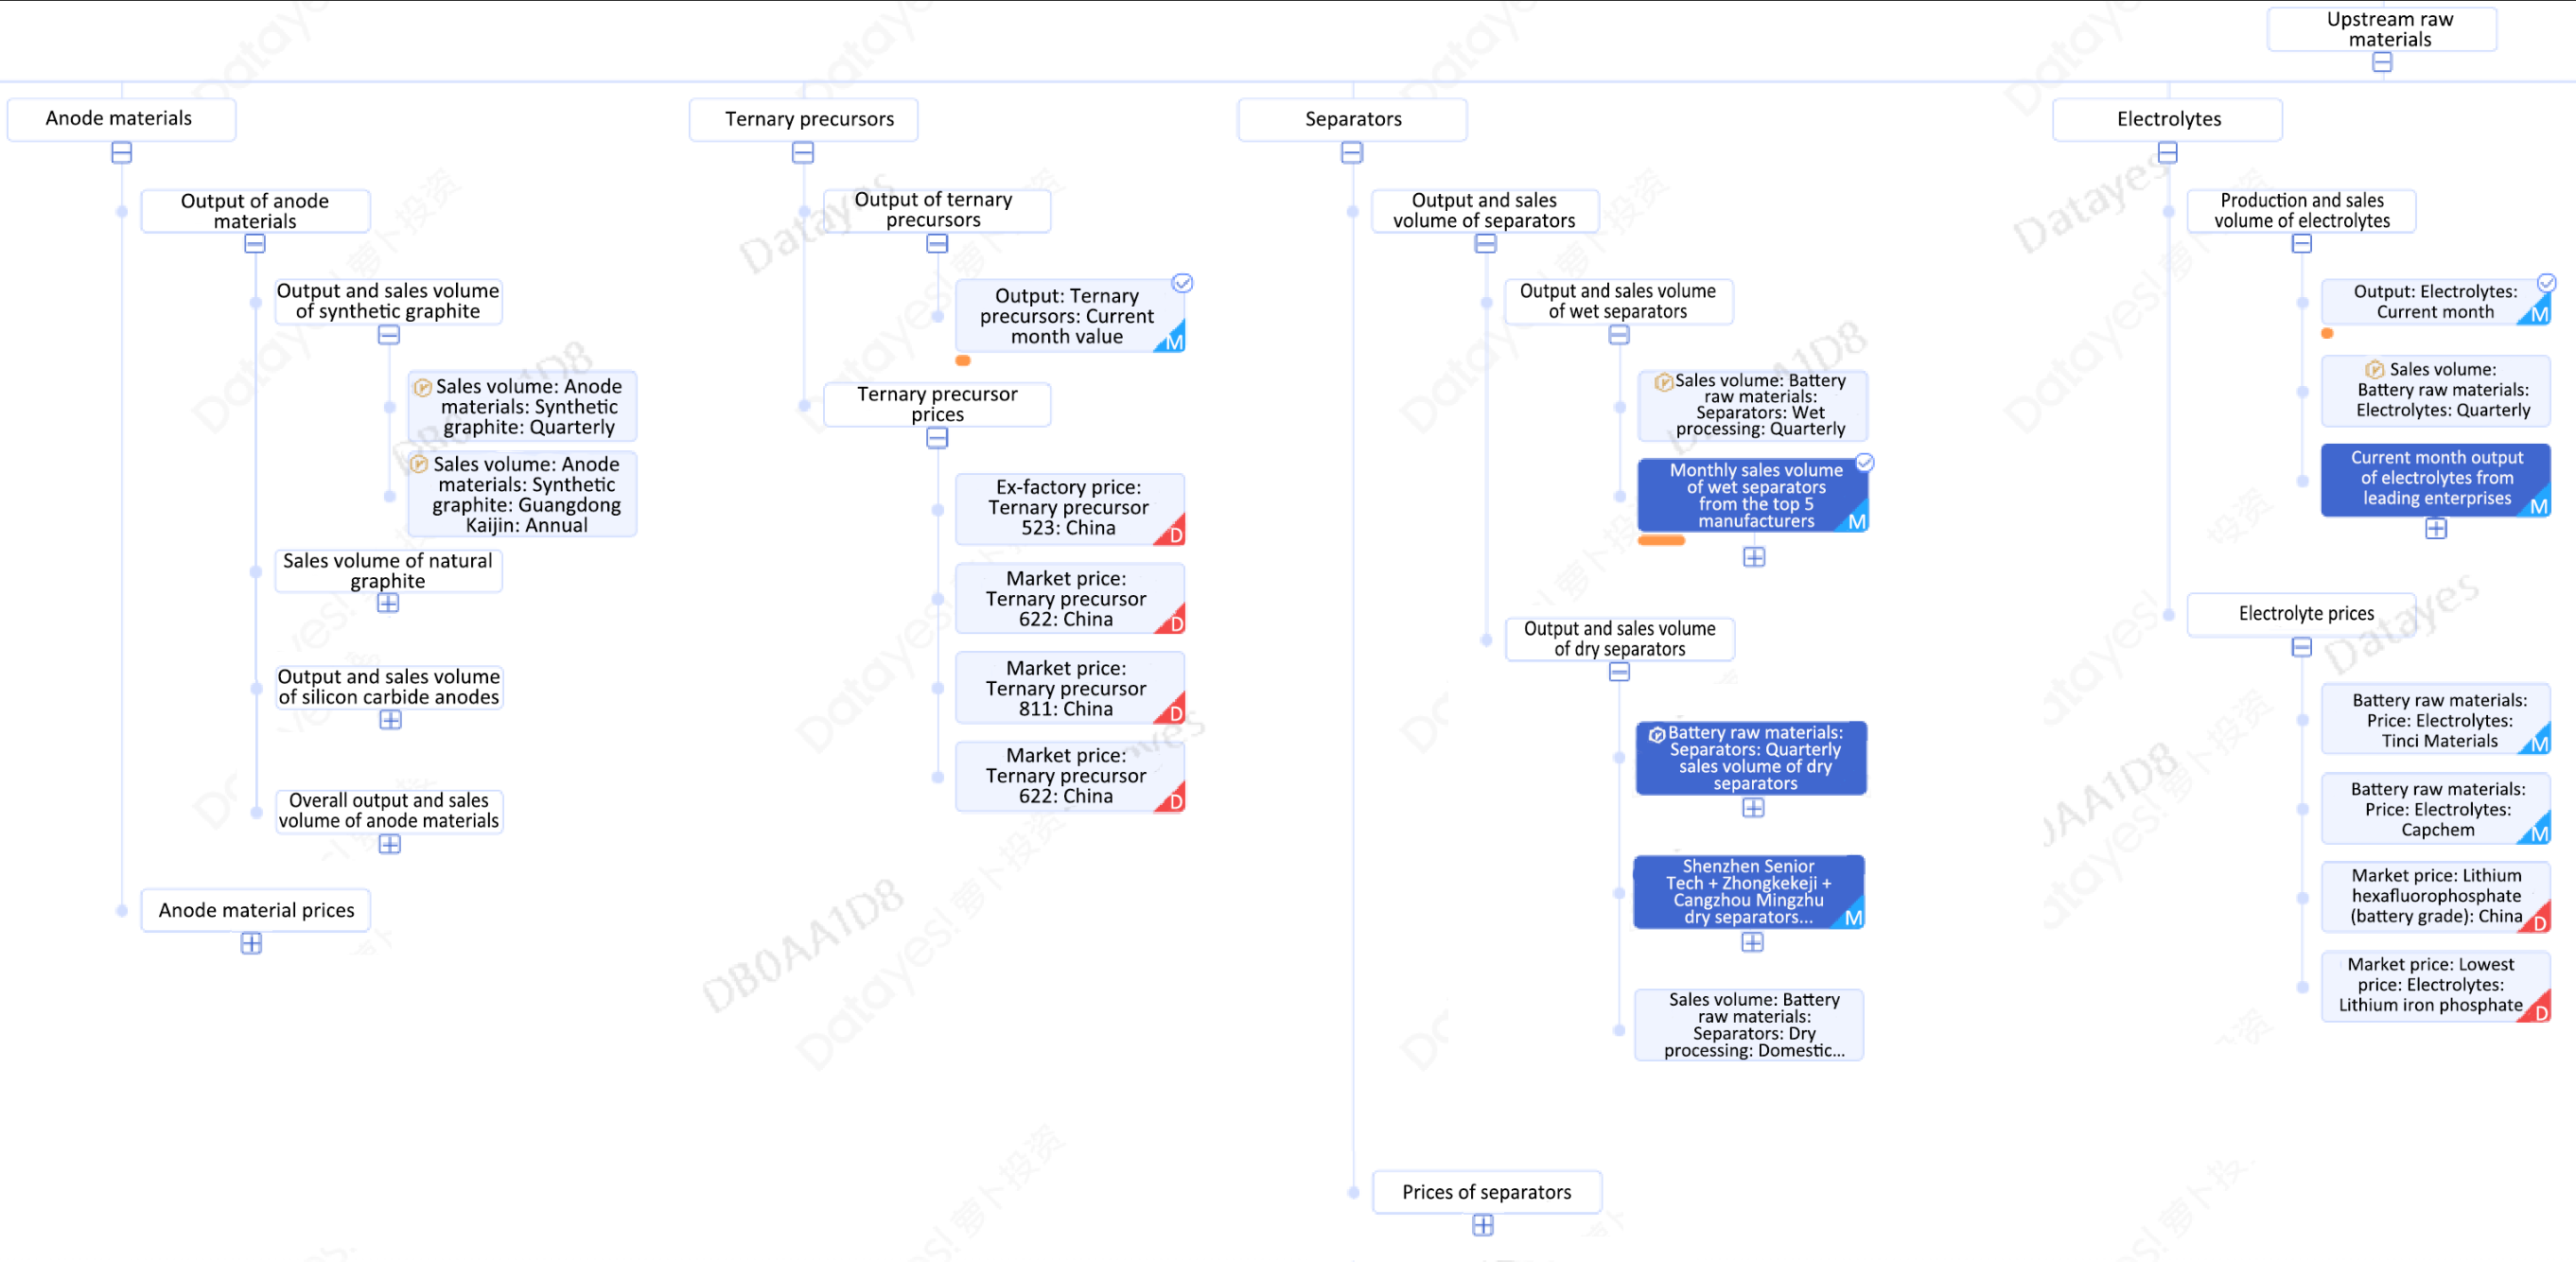
Basically, the overall demand of the traction battery industry is determined by the developmental trends of the NEV industry at home and abroad, which are in turn affected by macroeconomic conditions, industry policies, NEV sales volume, and the state of the necessary up-, mid- and down-stream supporting sectors along the industry chain. Therefore, to reflect the impact of the overall demand of the traction battery industry on CATL’s revenue, we have set up macro-factor and industry-factor nodes that parallel individual stock factors, and we have included some macro indicators as well as other indicators such as the NEV industry chain’s up-, mid- and down-stream output, prices and penetration rates.
From a macro perspective, taking into account the consumption attributes of traction battery downstream vehicles, we have added relatively typical indicators including total retail sales of consumer goods and consumer confidence indicators. At the industry level, we have screened a set of quantity and price indicators in terms of cathode and anode materials, ternary precursors and other traction battery upstream products, traction batteries, and vehicles. The specifics are shown in Chart 3.
Traction battery prices are affected by the company’s product structure, industry demand and supply, upstream raw material prices as well as the relative bargaining power between traction battery manufacturers and vehicle plants. Therefore, with regard to price factors, we have matched LFP and ternary traction battery prices as well as the prices of upstream cathode materials under industry factor nodes.
On the whole, market share is the external representation of the company’s comprehensive competitiveness. It is also the α of individual stocks according to our understanding. For traction battery manufacturers such as CATL, industry demand is an exogenous industry and macro factor, or what we generally understand as industry β. For CATL, price factors are relatively complex variables because they are affected by industry demand and other factors but are also closely related to the company’s own product structure. At different stages of the development of an enterprise, the above three key determinants will result in significant changes in the operation drivers of a company. In the next section, we will review and analyze the core factors behind the three key determinants of CATL, and also assess the historical development of CATL from the perspective of the three key determinants, while providing an outlook for future results.
Chart 3. Screenshot of the industry factor system module in CATL’s investment research framework
II. A review of the core factors of CATL’s earnings forecast model
In a previous article on the quantitative analysis of CATL, we discussed CATL’s traction battery installation capacity, vehicle output, cobalt sulfate output, output of cathode materials, output of wet separators and other factors in Table 1. Based on prior research, and on the basis of ongoing supplementation of some key factors, we have, in this article, classified these factors in terms of the three key determinants, namely, market share, industry demand and prices mentioned above. We have also analyzed and determined the effect of these factors in driving CATL’s revenue in the short and medium term, providing the basis for setting the weights of the factors involved in the computational process of the AI earning forecast model.
Table 1. Review and classification of some of CATL’s key factors
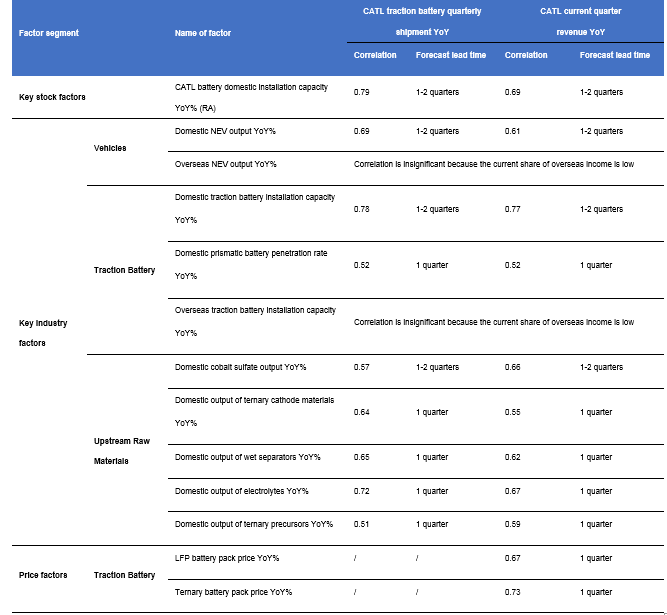
Source: Datayes, CBC Metal, China Association of Automobile Manufacturers, SPIR
In terms of market share, CATL’s domestic installation capacity is currently the factor that is representative of and directly related to the said CATL determinant; also included are financial indicators such as inventory turnover and capital expenditure that are specifically related to CATL’s operations. As high frequency indicators related to CATL’s exports are currently lacking, we can only use the company’s overseas income data as a factor to represent its overseas traction battery market share in the model.
Looking at CATL’s share of domestic installation capacity, from 2016-2019 it increased from less than 20% to a level of around 50%. This was a core driver of the company’s revenue growth in the past. Since 2020, CATL’s market share has stabilized on the whole, and has in fact slipped slightly quarter-on-quarter in Q1 2021, reflecting intensifying competition in China’s traction battery market.
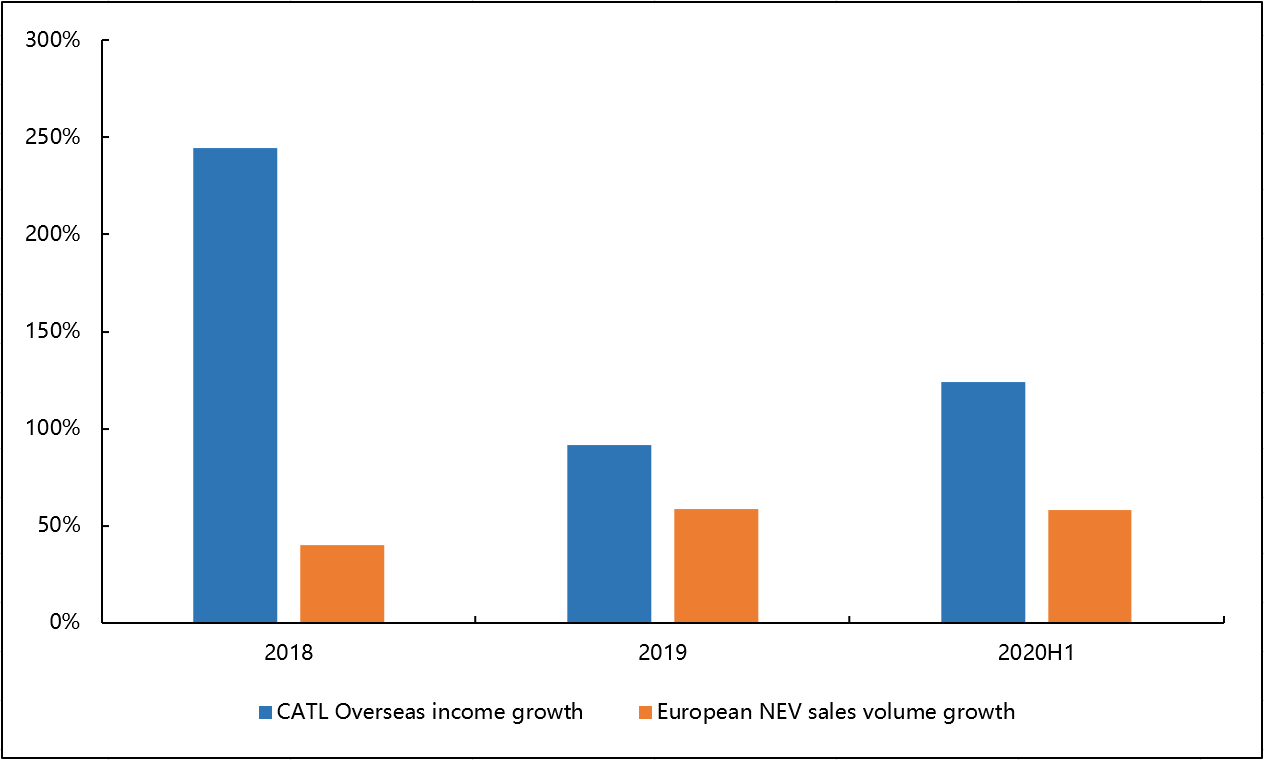
In general, CATL’s domestic market share will stabilize in the short to medium term, and its role as a revenue driver is expected to weaken. As the company has only started to penetrate the European market in 2018, and revenue growth in recent years has been significantly higher than European NEV sales volume. This indicates that CATL’s share of the traction battery market in Europe is rising significantly. The increase in its overseas market share could lead to more significant marginal contribution to CATL’s revenue growth going forward.
Chart 4. CATL’s overseas revenue growth and European NEV sales volume growth
Source: Datayes, CATL annual reports
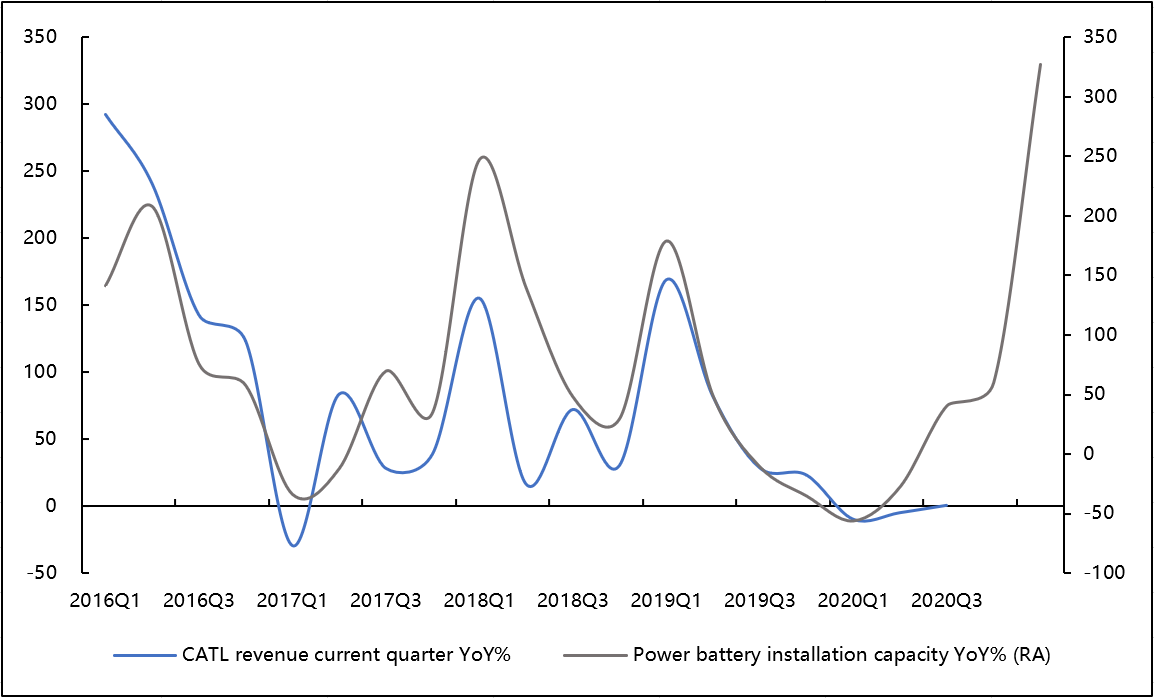
In terms of industry demand, we have added primary factors such as domestic traction battery installation capacity, domestic prismatic traction battery penetration rate, overseas NEV output, and overseas traction battery installation capacity. Domestic traction battery installation capacity is a representative indicator of domestic traction battery industry demand, and highly correlated to CATL’s revenue YoY. It has a forecast lead time of one to two quarters, as indicated in Chart 5.
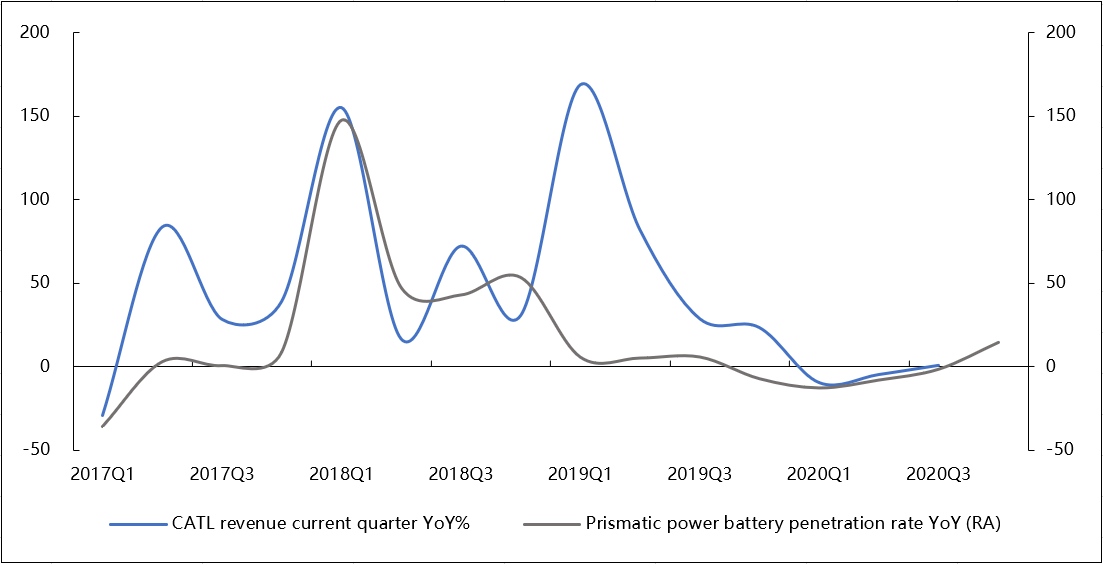
Given the different types of traction batteries in the market including prismatic, cylindrical and pouch, and that CATL primarily produces and sells prismatic batteries, we have introduced the prismatic penetration rate as an indicator, which has a correlation of 0.52 with CATL’s revenue. It currently has a forecast lead time of one quarter (see Chart 6.)
Based on rapid sales volume growth of NEVs in Europe, as well as the progress of CATL’s overseas plans, both overseas NEV output and overseas traction battery installation capacity indicators have also been included in the forecast framework. However, as the current share of CATL’s overseas income is still low (less than 5% in 2019), the correlation between the overseas indicators and CATL’s revenue is insignificant for the time being.
Chart 5. Domestic traction battery installation capacity YoY and CATL’s revenue YoY
Source: Datayes, CBC Metal, China Automotive Battery Industry Innovation Alliance
Chart 6. Domestic prismatic battery penetration rate and CATL’s revenue YoY
Source: Datayes, CBC Metal, China Automotive Battery Industry Innovation Alliance
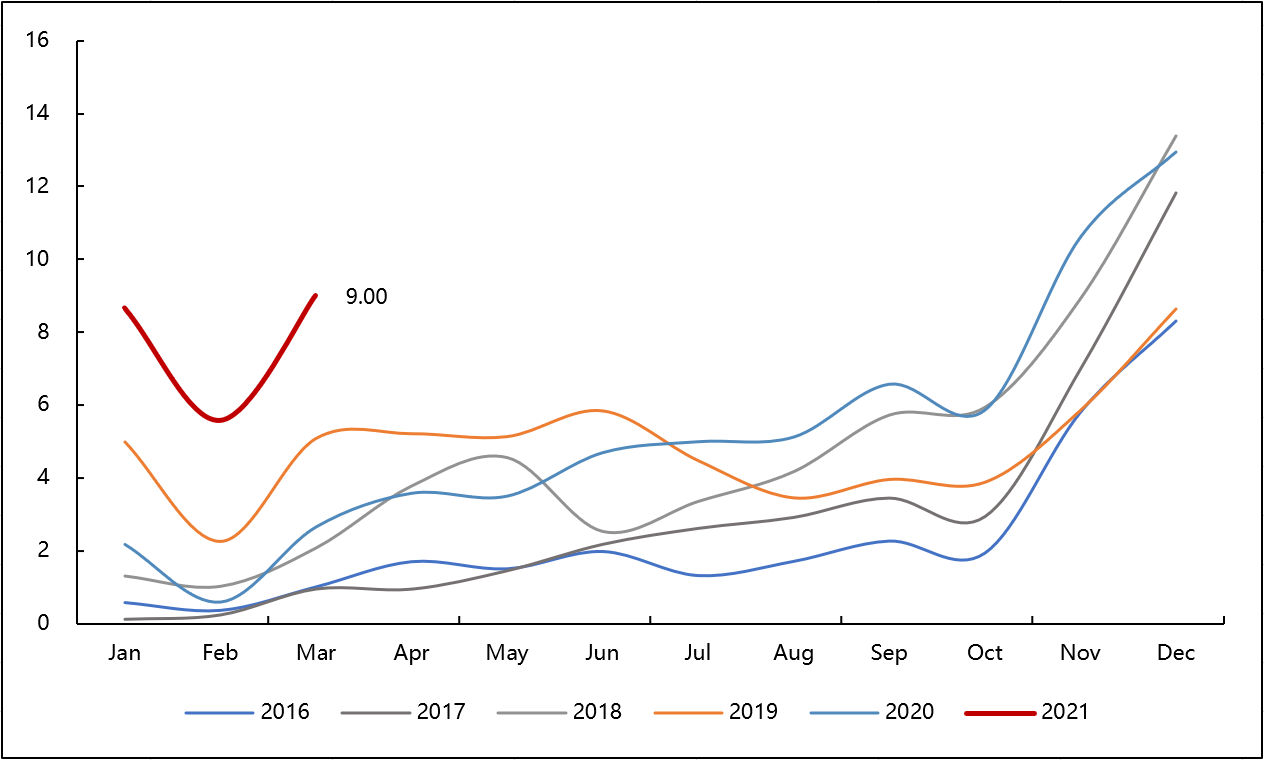
As illustrated in Chart 7, China’s monthly traction battery installation has begun recovery-oriented growth since the second half of 2020. In March 2021 in particular, installation capacity of the 9.0GWh units set a new YoY record in recent years; these have even reached near peak installation levels seen in past peak seasons, underpinned by solid market consumption after domestic EVs no longer depended on subsidies. In terms of supply, there is plethora of NEV offerings in China, led by high-end vehicles such as NIO and Tesla on the one hand, and high performance-to-price best-sellers such as Wuling Hongguang Mini on the other. These indicate that the NEV market in China is moving into a genuine consumption phase.
In a nutshell, following a relatively sluggish 2019 and 2020, the rapid growth seen in China’s NEV market in 2021 is a relatively definite trend. Therefore, the industry demand determinant is a core driver of CATL’s revenue growth in 2021.
Chart 7. Monthly traction battery installation capacity in China 2016-2021 (GWh)
Source: Datayes, CBC Metal, China Automotive Battery Industry Innovation Alliance
As for the ex-factory price of CATL’s traction batteries, firstly, the market price volatility of LFP batteries and ternary batteries directly affect CATL’s revenue; secondly, since 2020, the share of 811 batteries, which have a higher price, has been rising among CATL’s battery shipments. Such optimization of product structure would also contribute positively to the company’s traction battery shipment prices.
Taken as a whole, the share of 811 batteries is forecasted to continue to rise for CATL in 2021. Thanks to strong traction battery demand and soaring upstream raw material prices, the magnitude of the price decline for LFP and normal ternary traction batteries is expected to ease as well. Therefore, different from the past, the adverse impact of the shipment price of CATL’s traction batteries on the company’s revenue is expected to weaken significantly.
III. Breakdown of the three key determinants and revenue forecasts for CATL
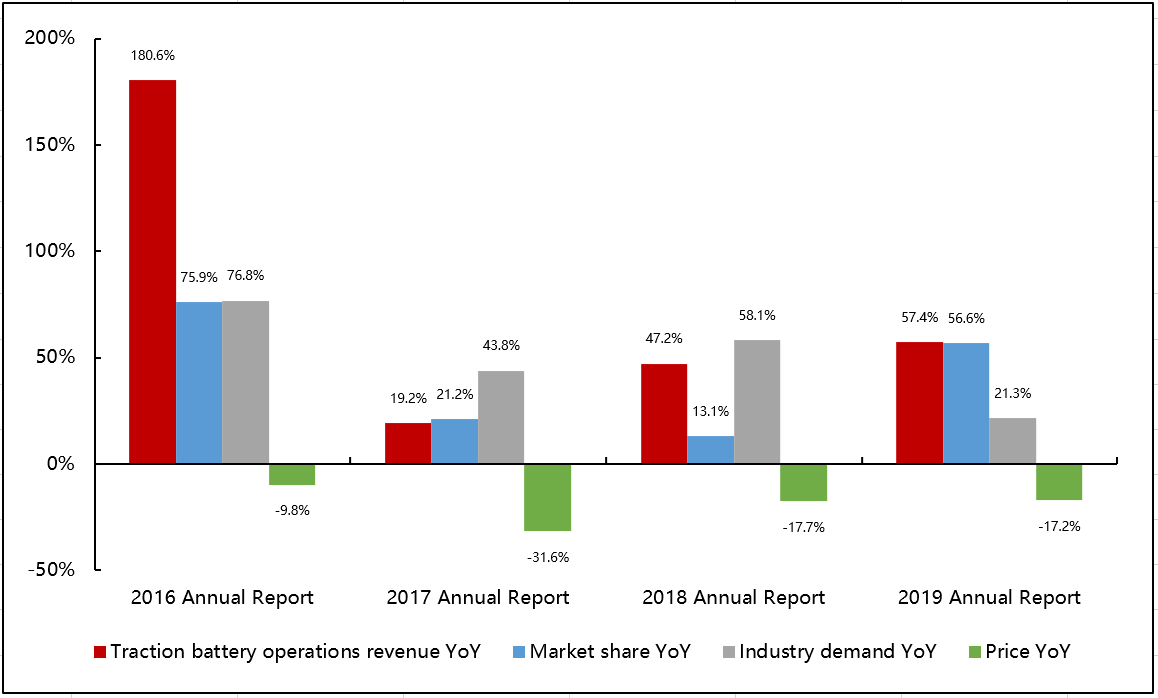
Coupled with the preceding analytical framework of the three key revenue growth determinants, we have performed a quantitative breakdown of CATL’s revenue volatility between 2016 and 2019. In 2016, domestic traction battery demand increased rapidly. The company put in place plans associated with strategic customers such as Tier 1 proprietary passenger vehicle brands, and saw its market share rise significantly. In addition, overall industry subsidies were still high at the time. As a result, there was little downward pressure on traction battery prices. α and β factor resonance led to enormous performance elasticity in the company’s results.
In 2017, subsidies were reduced, and industry demand was moderated. Traction battery overcapacity and technical cost reduction caused traction battery prices to plunge. The company’s market share edged upward, but falling prices and weakening β factors led to a sharp deceleration in the company’s revenue growth.
In 2018, industry demand improved to 58.1%, and the company’s market share continued to edge upward. The rate of decline of traction battery prices slowed, and 2018 revenue growth rebounded compared to 2017.
In 2019, domestic industry demand slowed to 21.3% because of the sharp reduction in subsidies. The magnitude of the decline in traction battery prices was basically comparable to that in 2018. On the back of cost, technology and size advantages, CATL’s domestic traction battery market share rose above 50%, driving the revenue growth of the company’s traction battery business back up to 57.4%.
Chart 8. Quantitative breakdown of CATL’s historical revenue growth drivers
Source: Datayes, CATL annual reports, China Automotive Battery Industry Innovation Alliance (Note: CATL market share = CATL traction battery shipments/Traction battery sales volume in China)
With COVID-19 in 2020, domestic traction battery sales volume stood at 65.9Gwh (China Automotive Battery Industry Innovation Alliance data), which was down 12.8% YoY. Based on the share of CATL’s installation capacity, its overall market share remained at around 50%. On the whole, domestic LFP and ternary traction battery prices fell by 20-30% YoY, but a higher share of CATL’s shipment of 811 traction batteries is expected to slow down the magnitude of falling overall shipment prices to a certain extent. In Europe, 1.26 million NEVs were produced, a major YoY increase of 126%. This is expected to result in rapid income growth for CATL’s overseas shipments and overseas business, with overseas income expected to double.
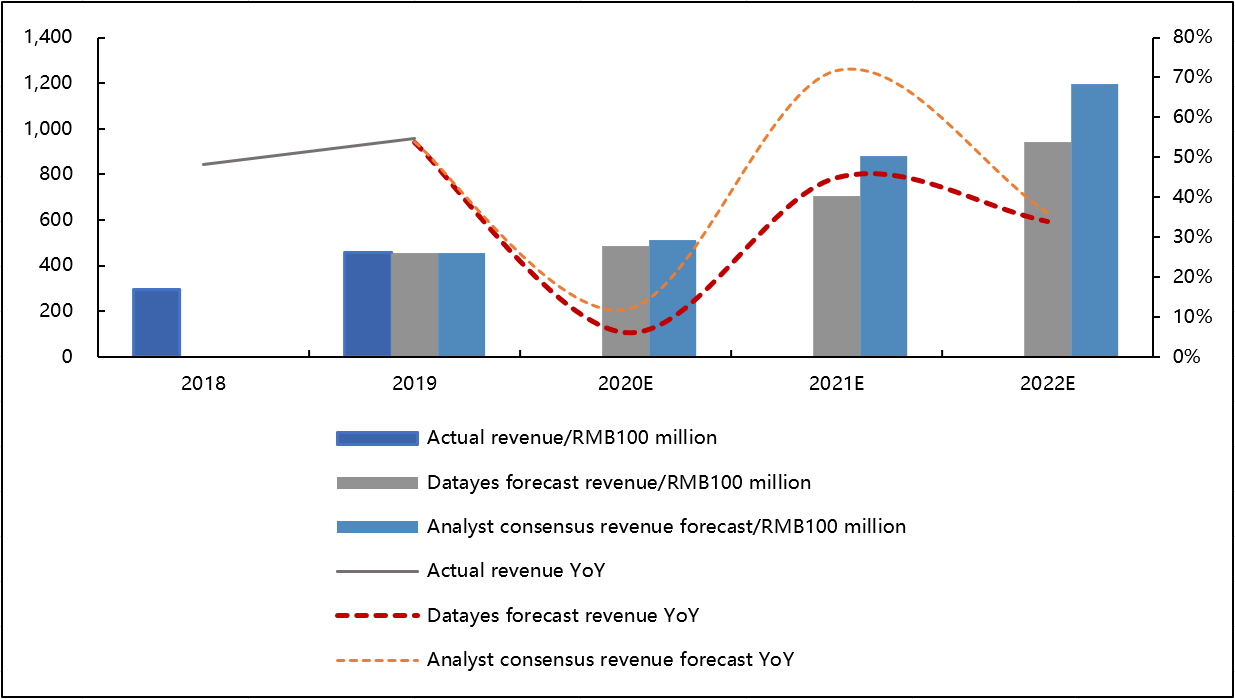
Taking all of the above into account, CATL’s 2020 revenue growth is expected to be weak. Our AI model estimates CATL’s 2020 revenue to be RMB48.59 billion, up 6.1% YoY. We believe that this estimate is at a reasonable level, and basically matches the conclusion we have obtained upon a comprehensive determination of the fundamental factors.
As for 2021, taking into account overseas traction battery manufacturers, as well as the layout and expansion of some of the vehicle plants and Tier 2 traction battery manufacturers, CATL’s domestic traction battery market share will unlikely continue to increase significantly, but is forecasted to continue to remain stable on the whole.
In terms of domestic industry demand, a review of the last two years revealed that spending power on EV products was able to withstand a sharp reduction in subsidies in 2019 as well as the tribulation of COVID-19 in 2020. Meanwhile, vehicle manufacturers continued to optimize and innovate at the supply end, and continually launched new products. The domestic NEV market is thus expected to usher in rapid growth in 2021. As for the European NEV market, EVs have entered a parity phase at the consumption level. A high growth trend appears certain.
In terms of price, soaring upstream raw material prices such as lithium carbonate in Q1 2021 has meant that some traction battery enterprises have begun to consider price hikes. Given this bullish industry backdrop, downward pressure on traction battery prices is forecasted to ease significantly in 2021.
Taking all of the above into consideration, industry demand (β factors) will be the primary growth driver for CATL’s results in 2021. This includes domestic traction battery demand and overseas traction battery market demand. At the same time, the adverse impact of price on the company’s revenue is expected to ease significantly, while market share is expected to remain generally stable. Our AI model forecasts CATL’s 2021 revenue to be RMB70.4 billion, up 45% YoY.
Chart 9: Datayes AI model’s revenue forecast for CATL
Source: Datayes
Datayes! opens the way to a new generation of intelligent investment experience.
By Wenxiang Cheng, Datayes
Risk disclaimer: The aforesaid content is a Datayes intelligent analysis example and does not constitute investment advice. Please go to r.datayes.com to use the specific analytical tools.
Customer Hotline: 400-082-0386
E-mail: info@datayes.com
Address:9th Floor, Wanxiang Building, No. 99 Lujiazui West Road,
Pudong New Area, Shanghai 200120 PRC
Follow Dateyes!
https://www.linkedin.com/company/datayes
Intelligent Investment Research
Fund Investment Advisor
Intelligent FOF
Portfolio Analysis and Risk Management
Quantitative Investment
Customer Hotline:400-082-0386
E-mail:info@datayes.com
Address:9th Floor, Wanxiang Building, No. 99 Lujiazui West Road,
Pudong New Area, Shanghai 200120 PRC

